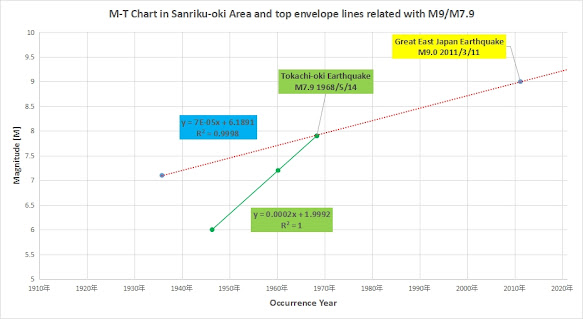
The line chart of magnitude in Sanriku-oki Area (rectangle area) as below,
For the predictive analysis of M9.0 (Great East Japan Earthquake)/M7.9 (Tokachi-oki Earthquake), some envelop lines are added on the graph as below,3 red lines are related with M9, and one green line is related with M7.9.3 red lines as approximation line are picked up, and extended until near M9 plot.
For M7.9 (Tokachi-oki Earthquake), one envelop line is added as green line, and picked up in the graph below,
The red line is as same as for green dots in the graph above. But, as there is only one envelop line at the occurrence of M7.9, the occurrence time couldn't be predicted.The correlation coefficient(R^2) of 3 dots is 1.0 including M7.9.Even though I found these envelop lines, there is problems how to find out them/how to judge the extension length still. But, some candidate of envelop line may help the predict of earthquake magnitude.


No comments:
Post a Comment