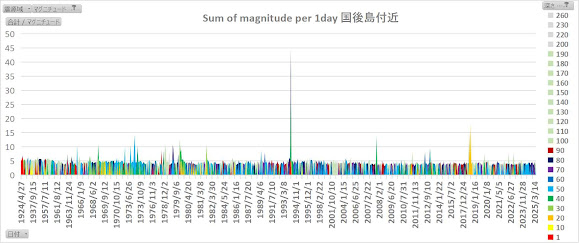
Sum of Magnitude per 1day in 国後島付近 (Kunashiri Island) is defined for epicenter's analysis as below,
note : Horizontal axis isn't linear.
Subscribe to:
Post Comments (Atom)
Analysis of Singularity Around Hyuga Nada(日向灘) - the 12 Singular Epicenter (#SP12-2) (micro-analysis)
[Object] Especially for the one of the 12 Singular Epicenter (#SP12-2), I tried the micro analysis in the narrow area around the #SP12...

-
MD-T chart in 釧路地方中南部 (Central Southern Kushiro region) MD values between 1978-2002 were going toward the shallow depth around 2km. In 200...
-
In Chugoku Area, Correlation between T (Occurrence Time) and D (Depth) in 19set/163set among 11 epicenters are more than 0.9900. The major ...


No comments:
Post a Comment