MD-T chart in 北海道東方沖(East offshore Hokkaido region)
Saturday, May 31, 2025
Sum of Magnitude per 1day in 北海道東方沖
Sum of Magnitude per 1day in 北海道東方沖(East offshore Hokkaido region)
note : Horizontal axis isn't linear.Friday, May 30, 2025
Counts of occurrence per depth in 択捉島付近
Counts of occurrence per depth in 択捉島付近(Etorofu Island) is shown as below graph,
Only 1km stands out from others. On the other hand, 100km and deeper ones are high ranks of the counts. Especially, 100km stands out from others except 1km. Such case is rare. In general, deeper ones are less than shallow ones. It seems there could be around M7 of 40km or 30km (or both) in several years. Recent curves have steeper slopes.
Thursday, May 29, 2025
Tuesday, May 27, 2025
Counts of occurrence per depth in 国後島付近
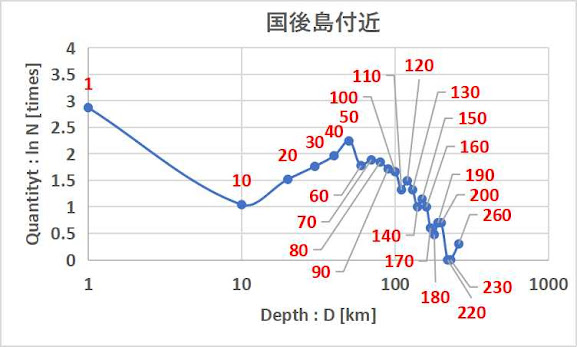
Counts of occurrence per depth in 国後島付近 (Kunashiri Island) is shown as below graph,
Only 1km's count has been stood out. On the other hand, the other shallow 10km/20km's counts are very low. The curves except 1km/50km were jammed around M6.9 of 30km in 1980. As same as it, the curves except 1km/10km/30-50km were also jammed around M7.2 of 100km in 1978.
- 1km(red)…This count of the earthquakes is the 1st. Before M5.4 in 1924, all of 1km were "unknown details" with no data of the magnitude. 7 months later from M5.4, M6.9 was occurred in 1925. Both M6.9 of 1km in 1925/of 30km in 1968 are the 2nd greatest in all depths (The 1st was M7.2 of 100km in 1978). The longest silent term is continuing since 1994 after the 2nd one between 1982-1994. The 1km earthquakes occurred in 1994 were aftershocks of M8.2 (Hokkaido East offshore Earthquake). The epicenter (of 30km) was out of this area.
- 50km(light blue)…The count is the 2nd since 1955. Recently, 50km is the most active depth. The the largest magnitude in this depth is M5.9 in 1979.
- 40km(green)…The count is the 3rd. 40km curve had overlapped with 30km since M6.7 in 1964. But, there was a rapid increase by M8.2 (Hokkaido East offshore Earthquake) in 1994. After the aftershocks of 40km, there was a long silent term 1994-2005. Then, the count has started the increase again after it. The largest magnitude in this depth is M6.7 in 1964.
- 70km(purple)…The count is the 4th. The curves of 70km/60km is overtaken and being overtaken. The largest magnitude in this depth is M5.7 in 1994.
- 80km(navy)…The count is the 5th. The curve almost stays between 70km and 90km. Before M8.2 (Hokkaido East offshore Earthquake) of 30km in 1994, there had been the rapid slope of 90km between 1992-1994. After M8.2, the rapid slope was taken over by 80km. In recent years, the curve is approaching 70km. The largest magnitude in this depth is M6.3 in 1994.
- 60km(blue)…The count is the 6th. The curves of 60km/70km is overtaken and being overtaken. The largest magnitude in this depth is M5.7 in 1994. After around 2010, the silent term has the tendency of becoming longer. So, 70km/80km curves overtook 60km. As the silent terms became longer since 2010, the count rank became lower. The largest magnitude in this depth is M6.2 in 1929.
- 30km(yellow green)…The count is the 7th. Though the curves of 30km/40km was overtaken and being overtaken, no significant increase of the count wasn't occurred after M8.2 (Hokkaido East offshore Earthquake) in 1994. On addition to it, there was the longest silent term between between 1995-2013. The largest magnitude in this depth is M6.9 in 1968. As the value is large, the count should become greater than now in future.
- 90km(brown)…The count is the 8th(100km's curve is the 9th). Though the curve was following 80km until M7.2 of 100km in 1965, it was delayed from 80km after the M7.2. The largest magnitude in this depth is M5.9 in 1957.
- 20km(orange)…The count is the 10th. There were 2 times major rapid increases after both M6.9 of 30km in 1980 and M6.8 of 30km in 1980. After the long silent term between 1987-2011, the count has been accelerated. The largest magnitude in this depth is M6.3 in 2018.
- 10km(yellow)…The count is the 11th. As same as 20km, this shallow 10km is also low rank of counts. The longest silent term of 10km is continuing since 1995. The largest magnitude in this depth is M5.6 in 1934. The value is less than 20km's largest value of M6.3. So, the update may be still far in the future.
- Others…omitted.
Monday, May 26, 2025
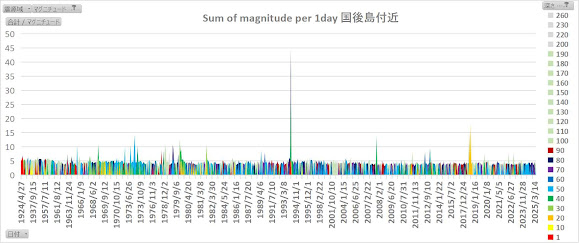
Sum of Magnitude per 1day in 国後島付近
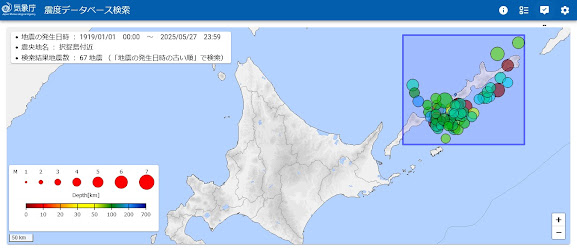
Sum of Magnitude per 1day in 国後島付近 (Kunashiri Island) is defined for epicenter's analysis as below,
note : Horizontal axis isn't linear.Saturday, May 24, 2025
Counts of occurrence per depth in 北海道北西沖
Counts of occurrence per depth in 北海道北西沖 (Northwest offshore Hokkaido region) is shown as below graph,
All 3 earthquakes more than M6.0 were occurred in deeper than 230km. M4.8 is the max in 1km-60km.
- 1km (Red)…This count of the earthquakes is the 1st. Before M4.5 in 1965, all of 1km were "unknown details" with no data of the magnitude. The M4.5 is the largest one in this depth.
- 10km(yellow)…The count is the 2nd. There was a longest silent term between 1919-1993. In late 2010s, the count increased with 20km rapidly, and it overtook 20km's one. It may also overtake 1km's one in near future. The the largest magnitude in this depth is M3.7 in 2024.
- 20km(orange)…The count is the 3rd. There was a longest silent term between 1919-1968. In late 2010s, the count increased with 10km rapidly. The the largest magnitude in this depth is M4.8 in 2013.
- 30km(light green)…The count is the 4th. There was a longest silent term between 1956-1996. The the largest magnitude in this depth is M4.6 in 2016.
- 40km(green)…There was only once as M4.3 in 1978.
- 50km… No occurrence
- 60km(blue) … There was only once in 1952. But, the magnitude is unknown.
- Others…There are few in 240km-330km. But, all 3 earthquakes more than M6.0 were occurred in these depth as shown in the chart above.
Sum of Magnitude per 1day in 北海道北西沖
Area map of 北海道北西沖 (Northwest offshore Hokkaido region) is defined for epicenter's analysis as below,
note : Horizontal axis isn't linear.Area map of 北海道北西沖
Area map of 北海道北西沖 (Northwest offshore Hokkaido region) is defined for epicenter's analysis as below,
Wednesday, May 21, 2025
Counts of occurrence per depth in 北海道西方沖
Counts of occurrence per depth in 北海道西方沖 (West offshore Hokkaido region) is shown as below graph,
Most earthquakes have been occurred in 1km/10km. As the max of all depth is M7.5 of 1km in 1940, the earthquake greater than M7.5 (or near M7.5) may be occurred in future as the combination of rapid increases among 1km, and other depth(10km, 20km, or so on). But, there is no sign of it except the long silent term of 20km since 2006.
- 1km (Red)…This count of the
earthquakes is the 1st one. Just before M7.5 in 1940, there was a long silent term between 1938-1940. Before M7.5, all of 1km were "unknown details" with no data of the magnitude. M7.5 is the largest one in all depth. After M7.5 until M6.7 in 1947, all of 1km except M5.9 in 1943 were also "unknown details". Before M6.7, there was no other depth earthquake except both M5.5 of 280km in 1945 and unknown magnitude of 10km in 1946. By M6.7, there was not only a rapid increase of 1km, but also the first 30km,40km,50km&70km within one month. Then, the silent term of 1km became longer and longer. After the long silent term between 1953-1958, M6.2 was occurred in 1959. After the aftershocks, the silent term of 1km became further longer. The longest silent term of 1km was occurred between 1968-1982. This term of 1km overlapped with the 2nd longest silent term of 10km between 1961-1983. Then, the silent terms became shorter and shorter especially after M6.1 of 10km in 2004. Recently, the silent terms is becoming longer gradually. The max magnitude of 1km is M7.5 in 1940.
- 10km (yellow)…The count is the 2nd. The first one was in 1946 just 1 year go of M7.5 of 1km in 1940. So, it seems to be the sign before the M7.5 even unknown magnitude. The longest silent term is between 1919-1946 until it. The max magnitude of 10km is M6.1 in 2004. The max magnitude of 10km is M6.1 in 2004.
- 20km (orange)…The count is the 3rd. But, it is still only 5 times. The last occurrence was M4.0 in 2006. The max magnitude of 20km is M5.9 in 1995.
- Others…The counts are only 0-2 times. The max magnitude of them is M6.1 of 270km in 2016.
Tuesday, May 20, 2025
Sum of Magnitude per 1day in 北海道西方沖
Sum of Magnitude per 1day in 北海道西方沖 (West offshore Hokkaido region)
note : Horizontal axis isn't linear.Tuesday, May 13, 2025
Counts of occurrence per depth in 北海道南西沖
Counts of occurrence per depth in 北海道南西沖 (Southwest offshore Hokkaido region) is shown as below graph,
According with the wider domino effect of depth range, the magnitudes become greater from M6.1 in 1950, M7.1 in 1982, and M8.3 in 1993.
Monday, May 12, 2025
Sum of Magnitude per 1day in 北海道南西沖
Sum of Magnitude per 1day in 北海道南西沖 (Southwest offshore Hokkaido region)
note : Horizontal axis isn't linear.Area map of 北海道南西沖
Area map of 北海道南西沖 (Southwest offshore Hokkaido region) is defined for epicenter's analysis as below,
Saturday, May 10, 2025
Counts of occurrence per depth in 根室地方南部
Counts of occurrence per depth in 根室地方南部 (South Nemuro region) is shown as below graph,
Only 1km has stood out from other depths. The most of earthquakes in this area may be occurred in 50-90km for a while. In 10-40km, there are only few earthquakes recently.
Friday, May 9, 2025
Analysis of Singularity Around Hyuga Nada(日向灘) - the 12 Singular Epicenter (#SP12-2) (micro-analysis)
[Object] Especially for the one of the 12 Singular Epicenter (#SP12-2), I tried the micro analysis in the narrow area around the #SP12...

-
MD-T chart in 釧路地方中南部 (Central Southern Kushiro region) MD values between 1978-2002 were going toward the shallow depth around 2km. In 200...
-
In Chugoku Area, Correlation between T (Occurrence Time) and D (Depth) in 19set/163set among 11 epicenters are more than 0.9900. The major ...


