In Chugoku Are, Correlation between Y (Occurrence Date) and M (Magnitude) in 22set/163set among 11 epicenters are more than 0.9900. The major correlation lines are in the graph below,

The decreasing correlation lines seems to be the top envelope line (see Analysis for the line chart of epicenter(Magnitude)-2) from #10 (M7.3 in 1927). In fact, both earthquakes around the decreasing correlation lines and M7.3 line were moving from East to West as a tendency. Similarly, earthquakes around the increasing correlation lines were moving from North to South as a tendency. The time line of these earthquakes is as below,
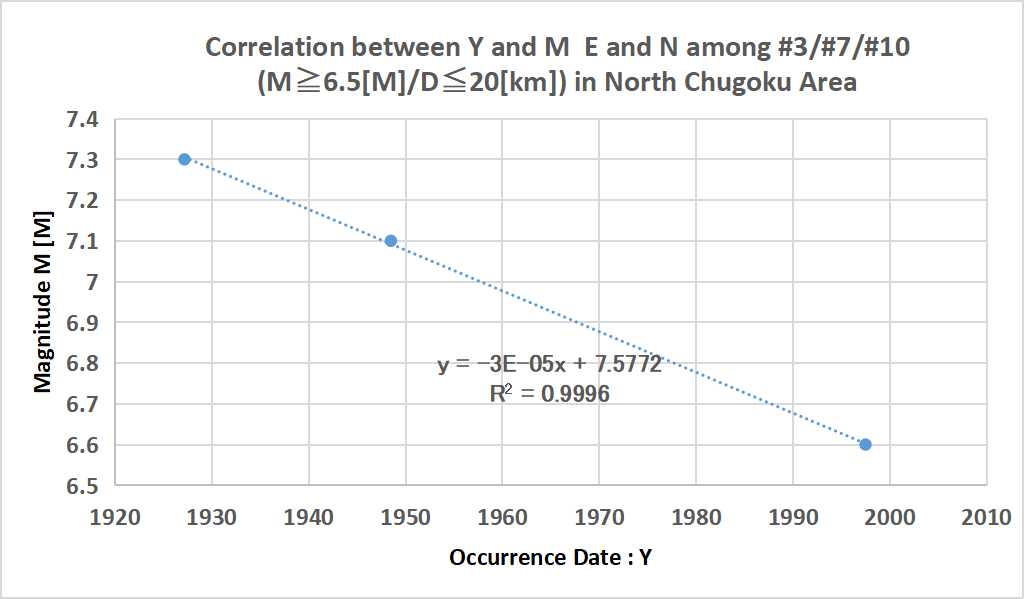
[along decreasing top envelope line]- #10 1927/3/7 Northern Kyoto
- # 8 1943/9/10 Eastern Tottori
- # 7 1948/6/28 Northern Fukui (mountainous area)
- # 6 1961/8/19 Ishikawa Kaga region
- # 5 1963/3/27 Wakasa bay(Fukui)
- # 3 1997/6/25 Middle Yamaguti
- # 1 2016/10/21 Middle Tottori
- #11 1925/5/23 Northern Hyogo
- # 9 1940/8/14 Around Oki Island
- # 6 1961/8/19 Ishikawa Kaga region
- # 5 1963/3/27 Wakasa bay(Fukui)
- # 4 1995/1/17 Osaka bay (Awazi Island)
- # 2 2000/10/6 Western Tottori
- #10 1927/3/7 Northern Kyoto
- # 4 1995/1/17 Osaka bay (Awazi Island)
- # 2 2000/10/6 Western Tottori
Some of strong correlation sets have other strong correlations also. As shown before, many earthquake's combinations have strong correlation between E and N.
For the set of #3/#7/#10,


No comments:
Post a Comment