Monday, June 30, 2025

Counts of occurrence per depth in 択捉島南東沖

 Counts of occurrence per depth   in 択捉島南東沖 (Southeast offshore of Etorofu Island) is shown as below graph,

Top 5 of magnitude were occurred shallower than 50km. 1km keeps the top of the count, and the curve slope is still steep. 30km/40km/10km curves follow 1km. But, they have longer silent terms now. As the greatest of all depths is M8.2 of 30km, 30km may grow more and approach to 1km in future. No sign has been observed at the moment.    

  • 1km(red)…The count is the 1st. The count rose up rapidly by the M8.1 of 10km in 1958. The M8.1 caused of 2 twin junctions of 20km/40km and 60km/ 80km. The largest one of 1km is M8.1 in 1963. After the M8.1, the curve slope is keeping steep. 
  • 30km(yellow green)…The count is the 2nd. The longest silent term is between 1927- 1948. During the term, the curve was overtaken by 1km/10km. After it, the slope became steep, and the curve overtook by the aftershocks of M8.1 of 1km in 1963. Moreover, there was the other rapid increase by M7.8 of 40km in 1969. 40km curve also had the rapid increase by the M7.8. But, 30km curve run away from 40km curve barely without overtaking. As same as it, in 1984, 30km curve run away from 40km curve before the overtaking. The M8.2 is the greatest one of all depths.
  • 40km(green)…The count is the 3rd. As wrote above, even though the rapid increase by M8.2, the curve couldn't overtake 30km curve. When the next chance of the overtaking in 1984, the curve went into the 2nd longest silent term between 1994-2008. After it, there were some long silent terms. So, the count hasn't grow enough to catch up with 30km. The largest one of 40km is M7.8 in 1969. The M7.8 was occurred at the junction of 40km/50km. The M7.8 generated both junctions of 30km/40km(twin) and 20km/50km/60km(triple). The increase stopped just after overtaking 10km. 
  • 10km(yellow)…The count is the 4th. The largest one is M8.1 in 1958. As wrote above, the M8.1 brought out the rapid increases. The 10km curve itself hasn't had the rapid increase. It was overtaken by 40km once. In 2019, it caught up with 40km. Then, the increase stopped in 2020.
  • 60km(blue)…The count is the 5th. After M7.8 of 40km in 1969, 60km/50km curves has been chased each other. The last occurrence was in 2022. The largest one is M7.3 in 1995.
  • 50km(light blue)…The count is the 6th. But, the count difference is only 2 times from 60km. As same as 60km, they had chased. But, the last occurrence of 50km was in 2011. The largest one is M6.5 in 1978. 
  • 20km(orange)…The count is the 7th. The longest silent term is between 1927 - 1952. After it, there were some rapid increases caused by huge earthquakes (M8.1 of 10km in 1958, M7.8 of 40km in 1969, and M8.2 of 30km in 1994) . The largest one is M6.2 in 1969.
  • Others…omitted. 

Sunday, June 29, 2025

MD-T chart in 択捉島南東沖

MD-T chart  in 択捉島南東沖 (Southeast offshore of Etorofu Island)


MD chart in 択捉島南東沖

MD chart in 択捉島南東沖 (Southeast offshore of Etorofu Island)


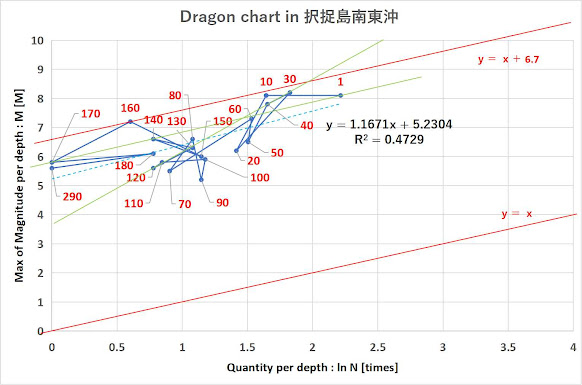
Dragon chart in 択捉島南東沖

Dragon chart in 択捉島南東沖 (Southeast offshore of Etorofu Island)


Sum of Magnitude per 1day in 択捉島南東沖

Sum of Magnitude per 1day in 択捉島南東沖 (Southeast offshore of Etorofu Island)

note : Horizontal axis isn't linear.
 

Distribution of Magnitude in 択捉島南東沖

Distribution of Magnitude in 択捉島南東沖 (Southeast offshore of Etorofu Island)


Distribution of Depth in 択捉島南東沖

Distribution of Depth in 択捉島南東沖 (Southeast offshore of Etorofu Island)


Area map of 択捉島南東沖

Area map of 択捉島南東沖 (Southeast offshore of Etorofu Island)is defined for epicenter's analysis as below,


Saturday, June 28, 2025

Counts of occurrence per depth in 網走沖

Counts of occurrence per depth in 網走沖(Offshore Abashiri region) is shown as below graph, 

Most earthquakes were occurred between 1km and 30km. In these shallow depths, the largest one is M6.3 in 1956. The M6.3 was occurred at the twin junction of 1km/20km. The greatest one of all depths was occurred in 150km as the single one of the depth.  


  •  1km(red)…The count is the 1st. The largest one of 1km is M6.3 in 1956. It was occurred at the twin junction of 1km/20km. Since 2017 being close to 10km, the count curve's slope has become steep rapidly.
  • 10km(yellow)…The count is the 2nd. After the longest silent term between 1963 - 2007, the count began the rapid increase. It accelerated after overtaking 20km curve. The largest one is M4.7 in 2007.
  • 20km(orange)…The count is the 3rd. After the twin junction of 1km/20km in 1956, there was the longest silent term between 1974-2009. After it, the count curve became steeper. But, the curve was overtaken by 10km in 2013. the largest one is M5.1 in 1974.
  • 150km…There was only M7.0 once in 1924. The M7.0 is the greatest of all depths. 
  • Others…omitted.
  • Friday, June 27, 2025

    MD-T chart in 網走沖

    MD-T chart in 網走沖(Offshore Abashiri region)


    MD chart in 網走沖

    MD chart in 網走沖(Offshore Abashiri region)


    Dragon chart in 網走沖

    Dragon chart in 網走沖(Offshore Abashiri region)


    Sum of Magnitude per 1day in 網走沖

    Sum of Magnitude per 1day in 網走沖(Offshore Abashiri region)

    note : Horizontal axis isn't linear.
      

    Distribution of Magnitude in 網走沖

    Distribution of Magnitude in 網走沖(Offshore Abashiri region)


    Distribution of Depth in 網走沖

    Distribution of Depth in 網走沖(Offshore Abashiri region) 


    Area map of 網走沖

    Area map of 網走沖(Offshore Abashiri region)is defined for epicenter's analysis as below,


    Tuesday, June 24, 2025

    Counts of occurrence per depth in 宗谷東方沖

    Counts of occurrence per depth in 宗谷東方沖(East offshore Soya region)is shown as below graph,

    In this area, the depths of the epicenters separate into 2 groups of shallow ones (1km to 30km) and deep ones (260km or deeper).  The magnitudes more than M6 are belong with deep groups more than 250km except 1km.   


    •  1km(red)…The count is the 1st. 1km accounts for 30% of all epicenters. The largest one of 1km is M6.3 in 1924.
    • 340km(gray)…The count is the 2nd. But, it is only half count of 1km.  The largest one is M7.5 in 1950, and it's also the greatest value of all depths.
    • 10km(yellow) and 350km(gray)…The count is the 3rd. But, it is less than 1/3 of the count of 1km. The largest one of 10km is M4.5 in 2016, and the largest one of 350km is M6.1 in 1992.
    • Others…omitted..  

    Sunday, June 22, 2025

    Distribution of Magnitude in 宗谷東方沖

    Distribution of Magnitude in 宗谷東方沖(East offshore Soya region)


    Dragon chart in 宗谷東方沖

     Dragon chart in 宗谷東方沖(East offshore Soya region)


    MD-T chart in 宗谷東方沖

     MD-T chart in 宗谷東方沖(East offshore Soya region)


    MD chart in 宗谷東方沖

     MD chart  in 宗谷東方沖(East offshore Soya region)


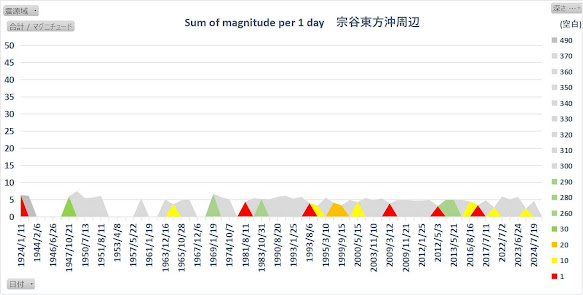
    Sum of Magnitude per 1day in 宗谷東方沖

    Sum of Magnitude per 1day in 宗谷東方沖(East offshore Soya region)

    note : Horizontal axis isn't linear.
     

    Distribution of Depth in 宗谷東方沖

    Distribution of Depth in 宗谷東方沖(East offshore Soya region) 


    Area map of 宗谷東方沖

    Area map of 宗谷東方沖(East offshore Soya region)is defined for epicenter's analysis as below, 


    Saturday, June 21, 2025

    Counts of occurrence per depth in 内浦沖

    Counts of occurrence per depth  in 内浦湾(Uchiura Bay)is shown as below graph,

    10km/1km's counts seems to be related with M't Usu's volcanic activity. There was no occurrence or only once in each depth of 30-90km. More than M6.0 was occurred as only M6.1 in 120km.

  • 10km(yellow)…The count is the 1st. 3 days ago of M't Usu's eruption in 2000/3/31, the counts of 10km/1km started increasing rapidly, and continued about for a week. There had been also the advanced rapid increase of 10km in 1997. It had started when the count catch up with 1km. The largest one is M5.3 in 2016. 
  • 1km(red)…The count is the 2nd. Just before the rapid increase in 2000, there had been the longest silent term between 1989-2000. The largest one is M5.2 in 1955. The last occurrence was in 2021.
  • 20km(orange)…The count is the 3rd. The longest silent term is between 1945 - 1974. The curve's slope became steeper since 2020. The largest one is M4.4 in 2021.
  • 120km(gray)…The count is the 4th. The longest silent term is between 1938 - 1992. It was stopped by M6.1 in 1992 as the largest one of all depths. The 2nd largest is M5.4 in 2007, and the last occurrence of 120km.
  • 130km(gray)…The count is the 5th. The first occurrence is M5.1 as the largest of 130km. 
  • others …omitted. Their counts are only 1 or 0. 
  • Thursday, June 19, 2025

    Area map of 内浦湾

    Area map of 内浦湾(Uchiura Bay)is defined for epicenter's analysis as below, 


    Tuesday, June 17, 2025

    Counts of occurrence per depth in 苫小牧沖

    Counts of occurrence per depth in 苫小牧沖 (Tomakomai offshore region) is shown as below graph,  

    30km/40km increased rapidly by the aftershocks of M6.7 in 2018 (Hokkaido Eastern Iburi Earthquake). The epicenter is located outside of the northeast corner of this area. The largest earthquakes are 2 times of M6.3, and they are included by 140km (only 4 counts).

    • 30km(yellow green)…The count is the 1st. Before Hokkaido Eastern Iburi Earthquake M6.7 of 40km in 2018, the count was 10th.  The aftershocks rose up the counts of 30km/40km/others even though the epicenter was out of this area (nearby the northeast corner of this area). They were caused of the junctions both triple of 40km/30km/20km and quartet of 100km/40km/30km/ 10km. In the triple junction, 30km had the largest aftershock as M5.5.  The M5.5 is also the largest one of 30km. 
    • 40km(green)…The count is the 2nd. The count also rose up rapidly by the M6.7 of 40km in 2018 (Hokkaido Eastern Iburi Earthquake). The largest one is M5.4 in 1920. 
    • 1km(red)…The count is the 3rd. The count increased after both M5.6 of 100km in 1931 and M6.3 of 140km in 1945. Then, the silent term became longer. The longest silent term is between 1974 and 1995. After 2 more long silent terms, there was the rapid increase of M5.6 of 1km in 2014. The M5.6 is the largest one of 1km. There was 3 years silent term between 2014-2017 before the M6.7 in 2018 (Hokkaido Eastern Iburi Earthquake). It seems to be one of sign of the M6.7 1 years ago. 
    • 70km(purple)…The count is the 4th. Around 1957-1958, 60km/70km/120km /130km curves concentrated on a place. After it, 3 continuous counts was occurred in 1960. Next, there was the longest silent term between 1960-1988. In result, 100km curve caught up with 70km. After it, 70km curve slope became steep. The increase has stopped since 2021 as same as 1km. The largest of 70km is M5.8 in 1941.     
    • 130km(gray)…The count is the 5th.Though there was the longest silent term between 1974-1992, the curve increased gradually. It stopped after the overtaking 60km in 2025 after 7 years silent term since the aftershock of the M6.7 in 2018 (Hokkaido Eastern Iburi Earthquake) . The largest of 130km is M5.3 in 1934.     
    • 60km(blue)…The count is the 6th. After the 3rd/2nd longest silent terms, the count increased gradually. Around 1995, the silent term became longer. The longest silent term is between 2010-2021. Then, the curve became steep again. The largest of 60km is M5.3 in 1990.       
    • 90km(brown)…The count is the 7th. After the longest silent term between 1954-1988, the curve became steeper. 3 years ago of the M6.7 in 2018 (Hokkaido Eastern Iburi Earthquake), the silent time became longer suddenly. The silent term was continued until 2021. It seems one of the sign of the M6.7. Then, the curve became steep again. The largest of 90km is M5.2 in 1937. 
    • 10km(yellow)…The count is the 8th. After M6.3 of 140km in 1945, 1km increased rapidly. On the other hand, 10km increased slightly. And the longest silent term between 1949-1998 was occurred. Then, the curve became steep again. The largest of 10km is M5.3 in 1930.     
    • 140km(gray)…The count is only 4 times. But, 4 earthquakes includes 2 times of M6.3 in 1945/1975, and M6.2 in 2023. M6.3 is the greatest magnitude of all depths.
    • others…omitted. 

    Monday, June 16, 2025

    MD-T chart in 苫小牧沖

    MD-T chart in 苫小牧沖 (Tomakomai offshore region) 


    MD chart in 苫小牧沖

    MD chart in 苫小牧沖 (Tomakomai offshore region) 


    Dragon chart in 苫小牧沖

    Dragon chart in 苫小牧沖 (Tomakomai offshore region) 

    30km/50km/60km/130km are located in a straight line. 20km/70km/120 are also located in a straight line.(orange kines)
     

    Sum of Magnitude per 1day in 苫小牧沖

    Sum of Magnitude per 1day in 苫小牧沖 (Tomakomai offshore region) 

    note : Horizontal axis isn't linear.
     

    Distribution of Magnitude in 苫小牧沖

    Distribution of Magnitude in 苫小牧沖 (Tomakomai offshore region) 


    Distribution of Depth in 苫小牧沖

    Distribution of Depth in 苫小牧沖 (Tomakomai offshore region)  


    Area map of 苫小牧沖

    Area map of 苫小牧沖(Tomakomai offshore region)is defined for epicenter's analysis as below, 


    Sunday, June 15, 2025

    Counts of occurrence per depth in 浦河沖

    Counts of occurrence per depth in 浦河沖 (Urakawa offshore region) is shown as below graph, 

    M7.1 of 40km is the greatest one of all depths, and was occurred the double junction of 40km/30km in 1982. The M7.1 induced not only the rapid increases of 40km / 30km / 20km, but also the sequential 2nd/1st longest silent terms of 1km. In result, 60km/70km/50km curves have overtaken 1km.     

    • 60km(blue)…This count is the 1st. 60km/70km have been overtaking and being overtaken. After overtaking 1km, both of 60km/70km almost overlapped. The largest magnitude of 60km is M6.7 in 1970. 
    • 70km(purple)…This count is the 2nd. The largest magnitude of 70km is M6.9 in 1932.   
    • 50km(light blue)…This count is the 3rd. After M7.1 of 40km in 1982, the curve rose up around 2004. The largest magnitude of 50km is M6.8 in 1968.
    • 1km(red)…This count is the 4th. There was the 2nd longest silent term between 1982-1995. Continuously, the 1st longest one was occurred between 1995-2011. After them, the silent term is becoming longer. The largest magnitude of 1km is M6.8 in 1944.  
    • 40km(green)…This count is the 5th. M7.1 was occurred at the double junction of 40km/30km curves in 1982. The M7.1 is the greatest one of all depths. 
    • 30km(yellow green)…This count is the 6th. The 30km curve follows the 40km with the similar pattern.The largest magnitude of 30km is M6.8 in 1931.
    • 10km(yellow)…This count is the 7th. 10km/90km have been overtaking and being overtaken. The rapid increase was occurred after M5.1 of 10km in 2011. By the aftershocks of M5.1, the longest silent term of 1km since 1995 was interrupted, and the curve overtook 20km/80km curves. The largest magnitude of 10km is M6.0 in 1937.  
    • 20km(orange)…This count is the 8th. The curve followed 40km/30km. As same as them, there were 2 major rapid increases as the aftershocks both of M6.8 in 1968 of 50km and of M7.1 of 40km in 1982.  The largest magnitude of 20km is M5.7 in 1942. 
    • Others…omitted. 

    Saturday, June 14, 2025

    MD-T chart in 浦河沖

     MD-T chart in 浦河沖 (Urakawa offshore region) 


    MD chart in 浦河沖

    MD chart in 浦河沖 (Urakawa offshore region) 


    Dragon chart in 浦河沖

    Dragon chart in 浦河沖 (Urakawa offshore region) 


    Sum of Magnitude per 1day in 浦河沖

    Sum of Magnitude per 1day in 浦河沖 (Urakawa offshore region) 

    note : Horizontal axis isn't linear.
     

    Distribution of Magnitude in 浦河沖

    Distribution of Magnitude in 浦河沖 (Urakawa offshore region) 


    Distribution of Depth in 浦河沖

    Distribution of Depth in 浦河沖 (Urakawa offshore region) 


    Area map of 浦河沖

    Area map of 浦河沖 (Urakawa offshore region) is defined for epicenter's analysis as below, 


    Friday, June 13, 2025

    Counts of occurrence per depth in 十勝沖

     Counts of occurrence per depth in 十勝沖 (Tokachi offshore region) is shown as below graph,  

    The count of 1km has been down from the 1st to 5th after the longest silent term between 1978 - 2024. On the other hand, 50km's count has been up to the 1st. M8.1 of 50km was occurred at the triple junction of 50km/40km/10km. 6 days later, M6.9 of 70km was also occurred at the triple junction of 70km/80km/60km. The M8.1 is the greatest one of all depths (1km's one is only M6.3). M8.1 may be transferred to 1km by domino effect in some day. 

    • 50km(light blue)…This count is the 1st. 50km/40km have been overtaking and being overtaken.As 40km overtook had long silent term between 1942 - 1948, 50km overtook 40km. Then, by M8.2 of 50km in 1952, 40km had more aftershocks and overtook 50km again. Later, 50km caught up with 40km by M7.0 of 50km in 1971. Around 1986, the become more steep, and 1km went into the longest silent term. So, the curve becomes top. The greatest earthquake of all depth is M8.2 of 50km in 1952. The M8.2 was occurred at the triple junction of 50km/40km/10km. 6 days later, M6.9 of 70km was also occurred at the triple junction of 70km/80km/60km. 
    • 40km(green)…This count is the 2nd. As described above, 50km/40km have been overtaking and being overtaken. But, the largest magnitude of 40km is M6.9 in 1961 (far less than M8.2 of 50km). The count doesn't reach to 50km. 
    • 60km(blue)…This count is the 3rd. The count has been increased smoothly.  The largest magnitude of 60km is M6.4 in 1943. 
    • 30km(yellow green)…This count is the 4th. 30km/20km had the double junction at M7.1 of 20km in 2003. The count jumped up after the M7.1 on the same count with 20km. The largest magnitude of 60km is M7.1 in 2008. 
    • 1km(red)…This count is the 5th. There was the longest silent term between 1978 - 2024. Before it, the count was the 1st. The largest magnitude of 1km is M6.3 in 1926.   
    • 70km(purple)…This count is the 6th. As described above, M6.9 of 70km was occurred at the triple junction of 70km/80km/60km in 1952. M7.1 was occurred the next count became the same as 30km after the long silent term of 30km. The largest magnitude of 60km is M7.1 of the triple junction in 1962.   
    • 20km(orange)…This count is the 7th. M7.1 was occurred at the double junction of 20km/30km in 2003. The M7.1 is the greatest magnitude of 20km. After 2021, the curve slope has become steep. So, there is a possibility of the rapid increase in near future. 
    • 80km(navy)… This count is the 8th. There was a steep slope increase around M7.1 of 70km in 1962. The largest magnitude of 80km is M6.4 in 1983. 
    • 100km(gray)… This count is the 9th.The largest magnitude of 100km is M5.6 in 1926. 
    • 10km(yellow)… This count is the 10th. In past, it was 4th after M8. 2 of 50km for a time. But, the silent terms became longer. The largest magnitude of 10km is M6.7 in 1936. 
    • others…omitted.

    Wednesday, June 11, 2025

    MD-T chart in 十勝沖

    MD-T chart in 十勝沖 (Tokachi offshore region)

    Since 1977, MD value has reached to the level under 10. It seems the earthquakes may become to activate.
     

    Counts of occurrence per depth in 秋田県南部

    Counts of occurrence per depth  in 秋田県南部 (Southern Akita Pref.)is shown as below graph,   The greatest magnitude is M7.2 of 1km in 2008. It ...