Monday, March 31, 2025

MD-T chart in 釧路地方北部

 MD-T chart in 釧路地方北部
 (redefined rectangle area of North Kushiro region)  


MD chart in 釧路地方北部

MD chart in 釧路地方北部
 (redefined rectangle area of North Kushiro region)

Oakan-dake, Anosanupuri, and Kamuinupuri are volcanoes.

Dragon chart in 釧路地方北部

Dragon chart in 釧路地方北部 (redefined rectangle area of North Kushiro region)


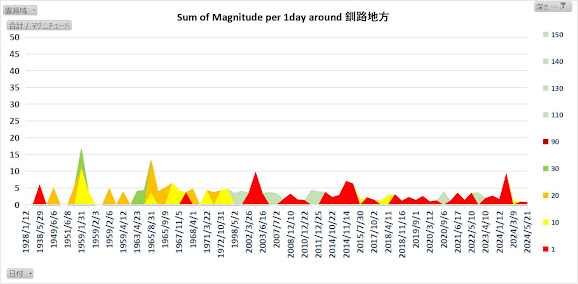
Sum of Magnitude per 1day in 釧路地方北部

Sum of Magnitude per 1day in 釧路地方北部
 (redefined rectangle area of North Kushiro region)   

note : Horizontal axis isn't linear.


Distribution of Magnitude in 釧路地方北部

 Distribution of Magnitude in 釧路地方北部
 (redefined rectangle area of North Kushiro region) 


Distribution of Depth in 釧路地方北部

Distribution of Depth in 釧路地方北部 (North Kushiro region) 


Area map of 釧路地方北部

Area map of 釧路地方北部 (North Kushiro region) is defined for epicenter's analysis as below,

Friday, March 28, 2025

MD-T chart in 十勝地方南部

 MD-T chart in 十勝地方南部
 (redefined rectangle area of South Tokachi region)  


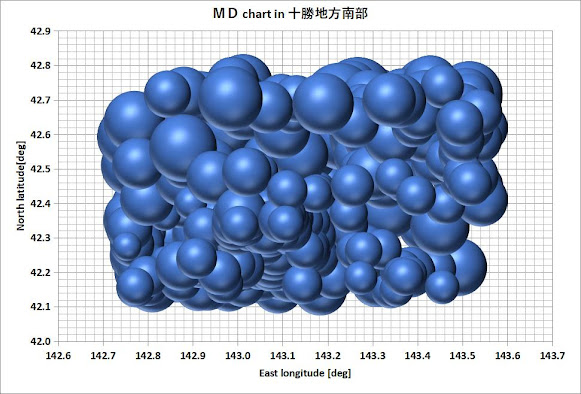
MD chart in 十勝地方南部

MD chart in 十勝地方南部
 (redefined rectangle area of South Tokachi region)  


Dragon chart in 十勝地方南部

Dragon chart in 十勝地方南部 (redefined rectangle area of South Tokachi region) 


Sum of Magnitude per 1day in 十勝地方南部

Sum of Magnitude per 1day in 十勝地方南部
 (redefined rectangle area of South Tokachi region)  

note : Horizontal axis isn't linear.


Distribution of Magnitude in 十勝地方南部

Distribution of Magnitude in 十勝地方南部
 (redefined rectangle area of South Tokachi region) 


Distribution of Depth in 十勝地方南部

Distribution of Depth in 十勝地方南部 (South Tokachi region) 


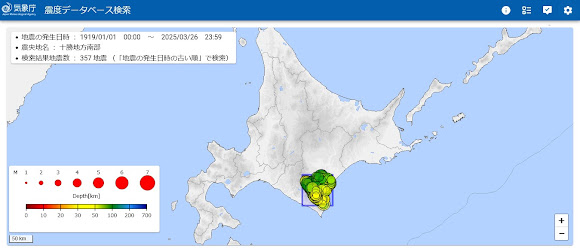
Area map of 十勝地方南部

Area map of 十勝地方南部 (South Tokachi region) is defined for epicenter's analysis as below, 


The positional relationship among the big earthquakes in Myanmar/New Zealand and the volcano of Indonesia in May,2025

 Recently, there were 2 big earthquakes and 1eruption in the world.

  • Eruption of the volcano of Lewotobi, Indonesia in 2025/03/24
  • M7.0,Western offshore South Island, New Zealand in 2025/03/25
  • M7.7,West coast of South Island, Myanmar in 2025/03/28

 The plotted positional relationship of them is as below,


These positions are almost on the same line. Even though the line isn't the shortest distance on the earth as sphere, I guess it may have some meaning.
 

Wednesday, March 26, 2025

MD-T chart in 十勝地方中部

MD-T chart in 十勝地方中部
 (redefined rectangle area of Middle Tokachi region)  


MD chart in 十勝地方中部

MD chart in 十勝地方中部 

 (redefined rectangle area of Middle Tokachi region) 


Dragon chart in 十勝地方中部

Dragon chart in 十勝地方中部
 (redefined rectangle area of Middle Tokachi region) 


Sum of Magnitude per 1day in 十勝地方中部

Sum of Magnitude per 1day in 十勝地方中部
 (redefined rectangle area of Middle Tokachi region)  

note : Horizontal axis isn't linear.
 

Distribution of Magnitude in 十勝地方中部

Distribution of Magnitude in 十勝地方中部
 (redefined rectangle area of Middle Tokachi region)   


Distribution of Depth in 十勝地方中部

Distribution of Depth in 十勝地方中部 (Middle Tokachi region) 


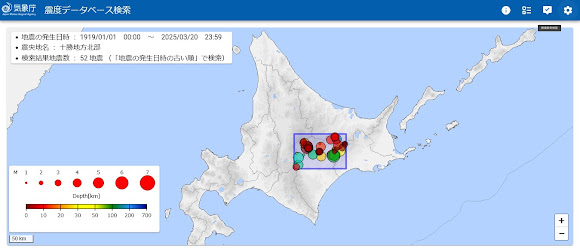
Area map of 十勝地方中部

Area map of 十勝地方中部 (Middle Tokachi region) is defined for epicenter's analysis as below,  


Saturday, March 22, 2025

MD-T chart in 十勝地方北部

MD-T chart in 十勝地方北部
 (redefined rectangle area of North Tokachi region)   


MD chart in 十勝地方北部

MD chart in 十勝地方北部

 (redefined rectangle area of North Tokachi region)  


Dragon chart in 十勝地方北部

Dragon chart in 十勝地方北部
 (redefined rectangle area of North Tokachi region) 


Sum of Magnitude per 1day in 十勝地方北部

Sum of Magnitude per 1day in 十勝地方北部
 (redefined rectangle area of North Tokachi region)    

note : Horizontal axis isn't linear.


Distribution of Magnitude in 十勝地方北部

Distribution of Magnitude in 十勝地方北部
 (redefined rectangle area of North Tokachi region)  


Distribution of Depth in 十勝地方北部

Distribution of Depth in 十勝地方北部 (North Tokachi region)  


Area map of 十勝地方北部

Area map of 十勝地方北部 (North Tokachi region) is defined for epicenter's analysis as below, 


Tuesday, March 18, 2025

MD-T chart in 日高地方

MD-T chart in 日高地方
 (redefined rectangle area of Hidaka region)  


MD chart in 日高地方

MD chart in 日高地方

 (redefined rectangle area of Hidaka region)   


Dragon chart in 日高地方

 Dragon chart in 日高地方
 (redefined rectangle area of Hidaka region)


Sum of Magnitude per 1day in 日高地方

Sum of Magnitude per 1day in 日高地方
 (redefined rectangle area of Hidaka region)  

note : Horizontal axis isn't linear.


Distribution of Magnitude in 日高地方

Distribution of Magnitude in 日高地方
 (redefined rectangle area of Hidaka region)  


Distribution of Depth in 日高地方

Distribution of Depth in 日高地方 (Hidaka region)  


Monday, March 17, 2025

Area map of 日高地方

Area map of 日高地方 (Hidaka region) is defined for epicenter's analysis as below, 


MD-T chart in 胆振地方

MD-T chart in 胆振地方
 (redefined rectangle area of Iburi region)  


MD chart in 胆振地方

MD chart in 胆振地方

 (redefined rectangle area of Iburi region)  

M't Usu is a volcano.


Dragon chart in 胆振地方

Dragon chart in 胆振地方
 (redefined rectangle area of Iburi region)  


Sum of Magnitude per 1day in 胆振地方

Sum of Magnitude per 1day in 胆振地方
 (redefined rectangle area of Iburi region)  

note : Horizontal axis isn't linear.

Distribution of Magnitude in 胆振地方

Distribution of Magnitude in 胆振地方
 (redefined rectangle area of Iburi region)  


Distribution of Depth in 胆振地方

Distribution of Depth in 胆振地方 (Iburi region) 


Area map of 胆振地方

Area map of 胆振地方 (Iburi region) is defined for epicenter's analysis as below, 


Thursday, March 13, 2025

Sum of Magnitude per 1day in 北見・紋別地方

 Sum of Magnitude per 1day in 北見・紋別地方
 (redefined rectangle area of Kitami & Monbetsu region) 

note : Horizontal axis isn't linear.
 

Distribution of Magnitude in 北見・紋別地方

Distribution of Magnitude in 北見・紋別地方
 (redefined rectangle area of Kitami & Monbetsu region) 


Distribution of Depth in 北見・紋別地方

Distribution of Depth in  北見・紋別地方 (Kitami & Monbetsu region) 


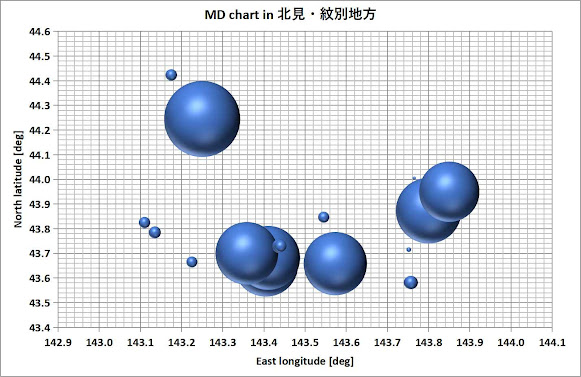
Area map of 北見・紋別地方

Area map of 北見・紋別地方 (Kitama & Monbetsu region) is defined for epicenter's analysis as below,


Counts of occurrence per depth in 釧路地方北部

Counts of occurrence per depth in 釧路地方北部 (North Kushiro region) is shown as below graph,  1km (red) …This count of the earthquakes is th...