MD-T chart in 上川・留萌地方
(redefined rectangle area of Kamikawa,Rumoi region)

(redefined rectangle area of Kamikawa,Rumoi region)

Sum of Magnitude per 1day in 上川・留萌地方
(redefined rectangle area of Kamikawa,Rumoi region)
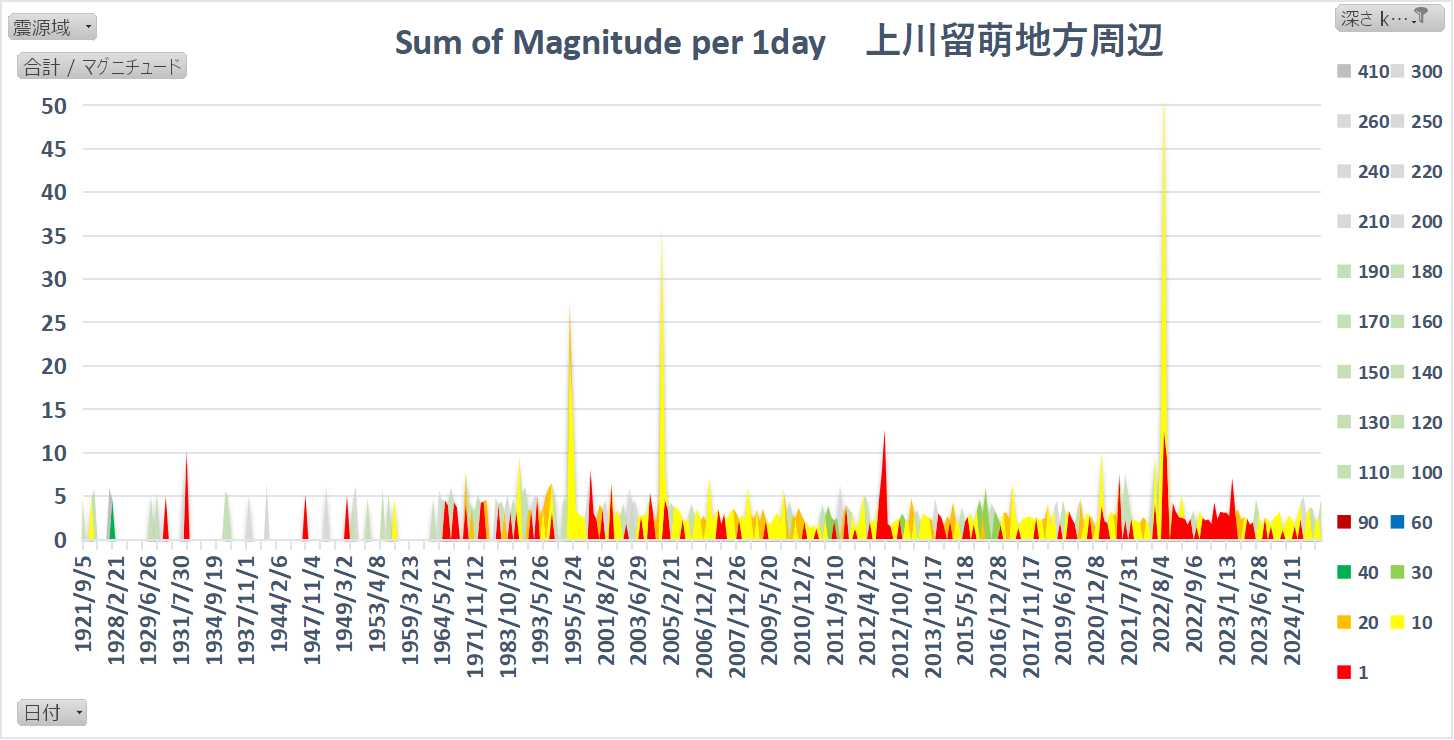
note : Horizontal axis isn't linear.
The max value is M5.4 at Nortern Kamikawa in 2022/8/11.
Area map of 上川・留萌地方 (Kamikawa,Rumoi region) is defined for epicenter's analysis as below,

MD-T chart in 渡島・檜山地方
(redefined rectangle area of Oshima,Hiyama region)

(redefined rectangle area of Oshima,Hiyama region)

There are discontinuous graph lines because of data of "Unknown details" with no Magnitude data.
Sum of Magnitude per 1day in 渡島・檜山地方
(redefined rectangle area of Oshima,Hiyama region)

note : Horizontal axis isn't linear.
The max value is M4.5 at Western Iburi in 2000/3/30.
Area map of 渡島・檜山地方 (Oshima,Hiyama region) is defined for epicenter's analysis as below,

MD-T chart is time series graph of MD (product of Magnitude and Depth) .
This is the example of MD-T chart in 三陸沖(Sanriku-oki) as below,

Next chart is limited of the maximum value of Vertical axis as 100 [M・km]. Before M9.0, the yellow blank area of shallow area was observed in MD-T chart. The blank area seems to be the sign of M9.0.

For the visual check of scatter diagram with the related quantity in the field, bubble chart is used in general. To know the Magnitude in the epicenter, the bubble chart of Magnitude with the longitude/latitude, huge magnitude bubble may cover the neighborhood bubbles cover of a and bed with it. For convenience's sake of visual check, MD is defined as the product of Magnitude and Depth. To avoid MD=0, 0 km is treated as 1 km.
The example of MD chart is as below,

There is a tendency of larger bubbles of deeper earthquakes. As the frequency of deeper ones is lower, MD is convenient for rough visual check of the bubble chart of earthquakes as including both information of Magnitude and Depth.
The demerit of MD chart is no display of the dot of "Unknown details" with no data of Magnitude.
(redefined rectangle area of Ishikari,Sorachi,Shiribetsu region)

There are discontinuous graph lines because of data of "Unknown details" with no Magnitude data in both 70km and 100km depth.
The slope of the line between 40km/50km is almost 1.0. The slope of the line among 140km/160km/170km/180km is almost 1.0 also.
M6.7(40km) on the line between 40km/50km was 2018 Hokkaido Eastern Iburi Earthquake "北海道胆振東部地震" in 2019/2/21 (37km).
Sum of Magnitude per 1day in 石狩・空知・後志地方
(redefined rectangle area of Ishikari,Sorachi,Shiribetsu region)

note : Horizontal axis isn't linear.
The max value is at Hokkaido Eastern Iburi Earthquake in 2018/9/6.
Distribution of Magnitude in 石狩・空知・後志地方
(redefined rectangle area of Ishikari,Sorachi,Shiribetsu region)

Distribution of Depth in 石狩・空知・後志地方 (redefined rectangle area of Ishikari,Sorachi,Shiribetsu region)

Area map of 石狩・空知・後志地方 (Ishikari,Sorachi,Shiribetsu region) is defined for epicenter's analysis as below,

[背景] 気象庁の有感地震全データを東経北緯を0.1度単位深さを1km単位のグリッドに分けた場合、M7以上の震源、かつ段数2段目あるいは3段目以上のグリッド震源は12震源しか存在せず、12の特異震源と呼んでいる。その中の発生順で4番目の宮城県沖の震源#SP12-4について、その...


